The touchstone for Australasian banking sector trends is the Commonwealth Bank of Australia (CBA), and CBA’s recent share price surging towards $120 has provided another catalyst for many to ask about the outlook for bank share price performance. For equity analysts, we think about the price to earnings ratio as an indicator of valuation; CBA’s has now topped 21 times expected earnings, a mark that most analysts say make the bank the most expensive of any systematically important large bank in the world, and in the league of fast-growing emerging market banks. Imagine you gained a minimum allocation of 400 shares at the IPO in 1991 – some A$2,160, you would now be sitting on $261,000 of net worth today.
As Australia’s largest company, CBA has created value for pension funds, and retail investors. However, at some point, high valuations are more typically associated with a lower near-term outlook for shareholder returns.
Obviously better profits would be a positive problem. Most investors would rather have a profitable banking system, reinvesting in new client-focused technology, and providing the backbone for the economy and the share market more specifically. Compare that position to having a bank or the banking system with losses, perhaps requiring a dip into retained earnings, the drawing down of various capital tiers, or calls on shareholders. Or worse still, care and maintenance from the central bank and, ultimately, taxpayers. No apologies here, the world is better off with a profitable banking system.
For more than a decade CBA (and ASB here in New Zealand) have been leaders in client-focused innovation and value creation. Not to say any of the banks covered themselves in glory through the Hayne Commission inquiry into banking conduct, however, when you think about the last decade, CBA has consistently led net promotor scores in an industry where the regulatory burden has moved one way.
In the last six months total shareholder returns for all the largest four banks have been extraordinary in the context of very little change in forward-looking earnings and dividends.
Before Easter we met with several banks and some stalwarts of the Australian banking analyst community, Brian Johnson and Jon Mott, both of whom have bruises and neither pull punches from decades of covering the banking sector.

Brian Johnson. Bank sector analyst, MST Marquee. Photo courtesy AFR
Neither will recommend buying CBA today; but both say CBA is simply the best bank. In October, the market was still in the mode of being concerned about impairments, net interest margins were under pressure, labour costs were rising (banks are big employers) and technology investment demands continuing (Westpac announced a further $3bn tech simplification plan just before Easter). None of these influences have significantly melted away, but the key to the recent surge in bank share prices largely reflects positioning. Back in 2023, institutional investors were very underweight the banking sector, and global short sellers still favoured backing their rising impairment story. It doesn’t take much for a momentum story to crowd-in investors, particularly when three of the large banks (CBA, NAB, WBC) and Macquarie have share buyback plans to also create a short squeeze. And yet, if you think about every driver of bank profitability, nothing has really changed. Competition for mortgages is still hot, deposit rates are still squeezing interest margins, and, ever so slowly, impairments and arrears are rising. It’s possibly the last factor where the market has moved its thinking most dramatically as employment has been much stronger in Australia.
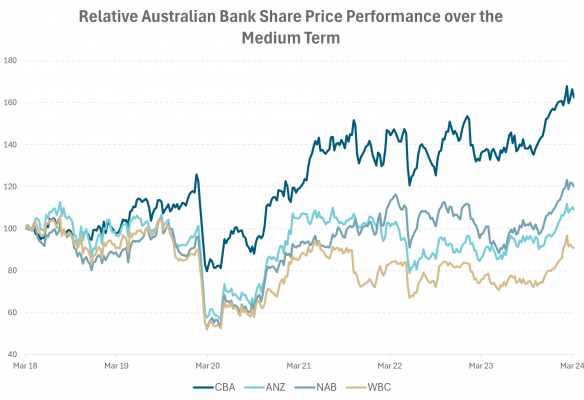
Australian bank share prices have performed strongly, particularly over the last six months.

Source: Bloomberg, Harbour
John Storey (UBS) presented to us his ‘what if’ analysis on the collective provisions of the banks for future potential impairments. We report more of those findings in our impairment report, however, just noting that our view is consistent with UBS’ who stated in our meeting that “very optimistic assumptions are required to justify the recent run-up in bank share prices”. Specifically, we can gain a detailed breakdown of changes to the expectations for key drivers of bank profitability.
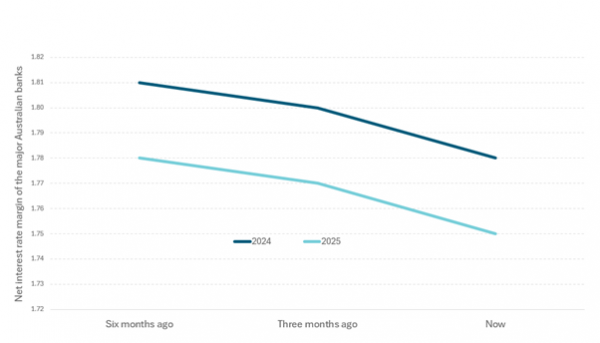
Across the major banks, trends in the last six months of key indicators have all marginally slipped. For instance, net interest margin expectations are still expected to drop from 2024 to 2025, but that fall has accelerated with expectations revised from 178bps to 175bps; revenue expectations have dropped by about 2%-3% from $92.2bn to $90.9bn; and cash profits have fallen from $50.1bn to $47.0bn. If you looked down from 30,000 ft, you might be surprised to see bank share prices up 15-20% at the same time.
Australian major bank net interest margin expectations are falling

Source: UBS, April 2024
There are two signals that might swing a potential change in narrative. Actual bad debts have fallen from $6bn to $5.8bn. It’s a small delta, but the fact is that low unemployment and higher house prices sharply narrow the scope for a rise in bad debts right now. As a result, bad and doubtful debt expectations for 2024 have fallen sharply. Structurally, banks have pulled back unsecured consumer lending where typically stress is first displayed. Westpac told us the total number of houses in their possession was still near cyclical lows at “around 200 homes”; CBA implied a similarly low number with “less than 2 basis points” of the value of loans relating to homes in possession and “the number of houses in the hundreds.” Secondly, analysts have had very low expectations for loan and credit growth: in the order of 3-4% across the system. Current major bank gross loans and advances are in the order of A$3.24trn. Six months ago, analysts had the slimmest of growth numbers for 2025 to $3.34trn. Now that has lifted to $3.37trn. That’s another $30bn of lending.
Every 1% jump in the growth of loans and advances adds about 4% to bank sector earnings.
Without writing a treatise, it’s hard to conclude that the recent rise in bank share prices has been supported by a sustained rise in profitability expectations. In fact, it’s the opposite: pre-provision profit expectations for the sector keep slipping. Valuations are now quite stretched relative to both the broader ASX200 and global bank valuations.
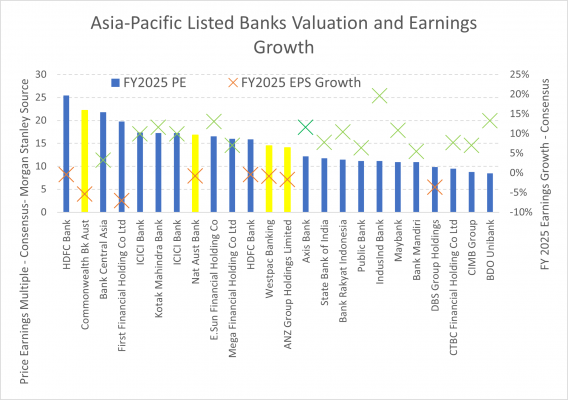
All four Australian major banks are among the most expensive regional banks despite having a lower expected earnings per share growth.
Australian Major Bank Valuations in a Regional Context

Source: Morgan Stanley Research, April 2024. The universe includes banks from the Asia-Pacific region excluding China and only including banks with a market capitalisation above US$11bn.
It is the case that further improvements in Australian employment, house prices and higher-than-expected lending growth could all change that picture as provisions could be released, seeing analysts lift revenue expectations through volume-related upgrades. Taken with our colleagues’ view that, globally, banks are trading at stretched multiples, it becomes harder to call for further outperformance relative to the broader market.
IMPORTANT NOTICE AND DISCLAIMER
This publication is provided for general information purposes only. The information provided is not intended to be financial advice. The information provided is given in good faith and has been prepared from sources believed to be accurate and complete as at the date of issue, but such information may be subject to change. Past performance is not indicative of future results and no representation is made regarding future performance of the Funds. No person guarantees the performance of any funds managed by Harbour Asset Management Limited.
Harbour Asset Management Limited (Harbour) is the issuer of the Harbour Investment Funds. A copy of the Product Disclosure Statement is available at https://www.harbourasset.co.nz/our-funds/investor-documents/. Harbour is also the issuer of Hunter Investment Funds (Hunter). A copy of the relevant Product Disclosure Statement is available at https://hunterinvestments.co.nz/resources/. Please find our quarterly Fund updates, which contain returns and total fees during the previous year on those Harbour and Hunter websites. Harbour also manages wholesale unit trusts. To invest as a wholesale investor, investors must fit the criteria as set out in the Financial Markets Conduct Act 2013.