- The RBNZ lifted the OCR by 50bps at the February MPS and continues to anticipate further tightening from the current 4.75% to 5.5% as inflation remains too high and labour markets are too tight for comfort.
- The North Island floods are likely to add to inflation and activity in the medium term. Beyond the floods, the tension between strong historical data and weak forward indicators continues in New Zealand – we believe the latter are more relevant.
- We continue to think the RBNZ doesn’t need to take the OCR above 5% as it forecasts, and financial markets expect.
The Reserve Bank of New Zealand (RBNZ) lifted the Official Cash Rate (OCR) by 50bp to 4.75% on 22 February and its updated forecasts showed that it continues to anticipate a 5.5% peak in the OCR, albeit in Q3 rather than the Q2 implied by the previous November 2022 Monetary Policy Statement (MPS) forecasts. The short story is that, despite some early signs that the pressure on prices is easing, inflation remains too high, and the labour market is too tight for comfort.
The North Island floods are likely to add to inflation and detract from activity, but the RBNZ is willing to look through the near-term effects. With crops and homes destroyed or damaged, food prices and rents are likely to rise in the coming months and near-term economic activity is likely to be lower. Horticulture and forestry businesses have been hurt by lost crops, damaged processing facilities and reduced access to ports. Households are likely to have reduced consumption due to business closure, limited access, lower confidence, and a negative balance sheet impact (assuming a degree of under-insurance). Some households, however, will increase consumption in the coming months as they seek to replace damaged goods such as vehicles, furnishings, carpet and appliances.
The medium-term impact of the floods is less ambiguous with an infrastructure rebuild that is likely to add to activity and inflation. The RBNZ anticipates the rebuild to eventually add one percentage point to GDP over the coming years, but the size and timing are critical. If the Government investment comes at a time when capacity constraints remain high, it might simply crowd out private sector investment – adding to inflation but not overall economic activity.
Another consideration is the degree to which the Government will need to seek additional funding from the bond market. This is highly likely and may come at a sensitive time, given:
- A looming recession, and the associated reduction in tax revenue, had already introduced the prospect of additional funding being required; and
- The market is already stretched, with an historically large current bond programme (c.$30bn/year) and upcoming issuance of a new 2030 government bond next month that is likely to require $4.5bn of successful bids for weekly government bond tender amounts (currently $400mn) to remain unchanged.
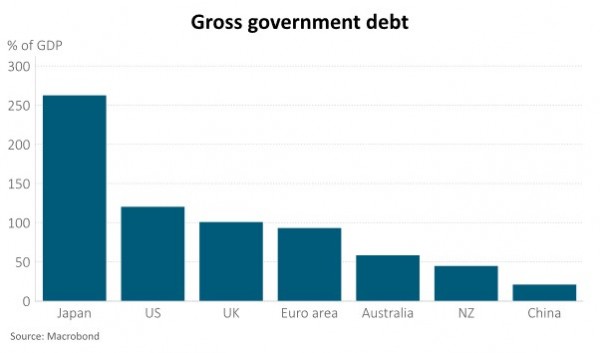
While this is likely to place upward pressure on government bond yields, particularly relative to interest rate swaps, it is likely to be tempered by an overall net debt position that is very low compared to international peers (see chart below).

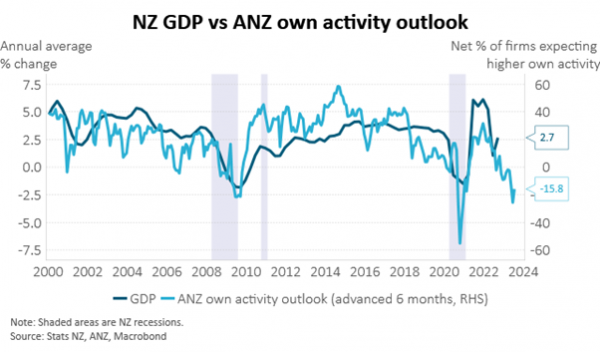
Beyond the floods, the tension between strong historical data and weak forward indicators continues - we believe the latter are more relevant. Incoming quarterly data continues to tell a story that economic activity was stronger than most anticipated last year, helped by the re-opening of borders that allowed tourists to return. This kept the labour market tight and allowed for high inflation (above 7% y/y) to persist. But this is ancient history. Business and consumer confidence is historically low, along with firms’ expectations of their own activity which are consistent with recession this year (see chart below).

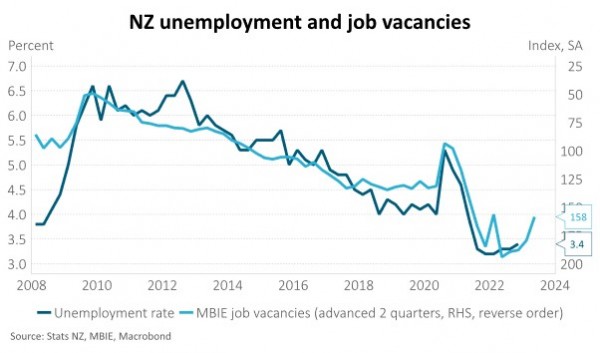
Leading indicators suggest monetary policy is working. Price and wage inflation on a quarterly basis are dropping. Job openings have fallen and suggest the unemployment rate should increase towards 4% by mid-year (see chart below). The housing market continues to soften, and prices remain 20-30% above the fair value implied by historical house price-to-income ratios and the percentage of income required to service a mortgage for a new buyer (for further discussion see, Harbour Navigator: Despite significant falls, NZ houses are expensive relative to incomes, 9 December 2022). Further house price declines are likely as high mortgage rates bite and unemployment picks up. Almost 50% of outstanding mortgages are due to re-fix over the coming year. The RBNZ now expects a further 10% decline in house prices, from 5% previously. The outlook for residential investment is particularly poor. The RBNZ forecasts a 15% contraction in the sector, beginning in Q2. Households are likely to continue reducing consumption and increasing savings as the economic outlook darkens and balance sheets lose value.

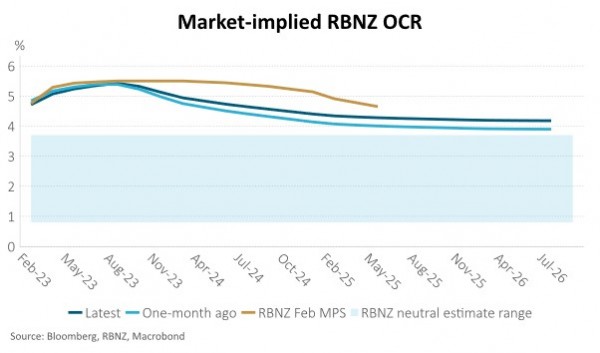
We continue to think the RBNZ doesn’t need to take the OCR above 5% as it forecasts, and financial markets expect. Further ahead, financial markets are appropriately, in our view, disagreeing with the RBNZ forecasts for the OCR to be above 5% until 2025, instead expecting the OCR to be about 80bp lower than that at the end of 2024 (see chart below). The risks, however, are balanced around this market pricing two years ahead. The rebuild from the floods is likely to add to activity and inflation around this time but the economy is also likely to be in a period of sub-trend growth, due to the lagged effects of monetary policy tightening.

IMPORTANT NOTICE AND DISCLAIMER
This publication is provided for general information purposes only. The information provided is not intended to be financial advice. The information provided is given in good faith and has been prepared from sources believed to be accurate and complete as at the date of issue, but such information may be subject to change. Past performance is not indicative of future results and no representation is made regarding future performance of the Funds. No person guarantees the performance of any funds managed by Harbour Asset Management Limited.
Harbour Asset Management Limited (Harbour) is the issuer of the Harbour Investment Funds. A copy of the Product Disclosure Statement is available at https://www.harbourasset.co.nz/our-funds/investor-documents/. Harbour is also the issuer of Hunter Investment Funds (Hunter). A copy of the relevant Product Disclosure Statement is available at https://hunterinvestments.co.nz/resources/. Please find our quarterly Fund updates, which contain returns and total fees during the previous year on those Harbour and Hunter websites. Harbour also manages wholesale unit trusts. To invest as a wholesale investor, investors must fit the criteria as set out in the Financial Markets Conduct Act 2013.
