The Harbour Social Spotlight is a three-part series summarising our recent research project into ESG-related issues.
- Health and safety, diversity and inequality are key issues related to the United Nation’s Sustainable Development Goals.
- In our second of three articles following our research project, we summarise our findings on health & safety, gender diversity and income inequality.
- We found a lack of injury frequency disclosures, with less than half the companies in our sample reporting on recordable injuries and lost time metrics.
- Gender diversity across total employees is broadly equal, but there is significant room to improve female representation in senior roles.
- Significant variance exists between sectors on our measure of income inequality.
Introduction
Health and safety outcomes, and developing a diverse and inclusive workforce, are crucial aspects in human capital management. The second part of our research project on social considerations, investigated measures of these aspects across the NZX-listed market through our analysis and company engagement. We also examined the social issue of income inequality and ways this can be addressed through certain staff remuneration practices.
Health and Saftey
Health and safety considerations have received heightened attention from companies on the back of COVID-19 and the resultant demanding conditions required to maintain employee health and wellness - especially mental health. They are a core part of operational performance for many companies, as any safety incident can cause project delays or lead to temporary shutdowns that may hinder production. Safety is often closely linked to executive remuneration that can reduce/eliminate bonuses paid to company management through balanced scorecards that feature metrics such as the number of serious injuries or fatalities. Lapses can lead to scrutiny by unions and stakeholders and affect the reputation of a company and its social license to operate.
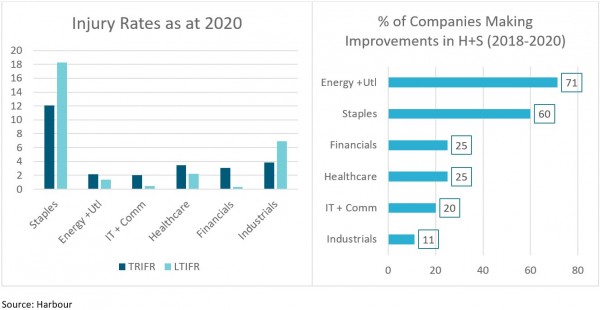
Regarding physical health and safety measures, we analysed the two most common forms of injury statistics: total recordable injury frequency rate (TRIFR) and lost time injury frequency rate (LTIFR). TRIFR measures the total number of injuries requiring medical treatment per million hours worked within an organisation while the LTIFR refers only to injuries that result in lost time from work, where a person needs to take some time off to treat the injury and can range from a sprain to permanent disabilities/fatalities.
Disclosure of both metrics were lacking with less than half of our sample reporting either. However, from those that did provide this data, a majority (55%) showed an improving trend in the TRIFR over the past few years. Most sectors, on average, had TRIFR range between 2 and 4 injuries per million hours, however the consumer staples industry stood out with the highest rate. Both the real estate and consumer discretionary sectors lacked any disclosure on their injury rates, making it difficult to assess their health and safety performance. Fisher and Paykel Healthcare is an excellent example of a company providing transparent disclosure on their health and safety data as well as strong performance in reducing their injury frequency rates over the past few years.

Mental health issues can also affect company performance through lower productivity and higher rates of absenteeism. Mental illness is a major issue in New Zealand with one in five adults diagnosed with depression, bipolar and/or anxiety disorder, and 7.4% of Kiwis reporting they have recently experienced mental distress.1 Our research showed that all the companies in our sample provided mental health services and counselling, with the most common service being access to a confidential employee assistance programme. Despite the high uptake in offering a mental health service, some companies did not specify what they provide, making it difficult to assess the efficacy of their mental health practices.
It is interesting to note that although all companies provided this support, the other wellbeing indicators and engagement scores from our first social spotlight vary over a large range. This could imply a recent implementation of such practices, or the presence of these services is only for box ticking purposes. It emphasises the need for companies to embed mental wellness practices to truly make a difference in employee wellbeing, engagement, and productivity.
Gender Diversity
There has been a rising focus on diversity considerations, particularly gender, by promoting a higher representation of women at the management and board levels as this has historically been low in New Zealand.2 One of the United Nation’s Sustainable Development Goals (SDGs) relates to achieving gender equality and empowering all women and girls (SDG 5). The first underlying target is focused on ending all forms of discrimination against all females everywhere3 and involves promoting and monitoring equality and non-discrimination on the basis of gender. This creates an impetus for governments, corporates and investors alike to prioritise these considerations.
There are now industry initiatives in place such as the 30% Club4 that involves the active encouragement of companies to target a ratio of at least 30% women in senior management and board positions. Another initiative, 40:40 Vision5, involves setting a target of 40% male, 40% female and 20% either/non-binary. We have observed some local corporates such as Spark that have adopted these targets and made excellent progress on meeting them.
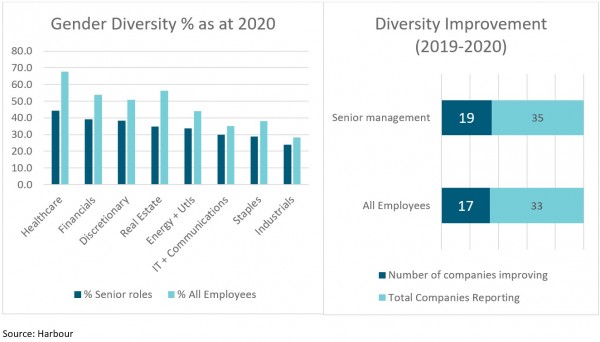
Our research across the New Zealand market has shown that companies’ current levels of gender diversity is almost equal (45% on average) among the total employee base, but this tends to lag at the senior management level (33%). Despite these encouraging levels, the trend over the past two years has shown limited progress, with only just over half of the sample increasing their female representation.

We would like to see further improvement in gender diversity over time, aligned with SDG 5, and we are supportive of the 30% Club and 40:40 Vision industry initiatives. We believe that the 30% level is a strong minimum target to strive for across the market for boards and senior management, but over the long term, moving towards 40% for both genders with 20% either provides the best balance and flexibility. We have already seen companies in New Zealand setting a target for 40:40:20 and, in some cases, already achieving this which represents leading practice in diversity and is positively encouraged from our investment perspective.
Diversity and inclusion also goes beyond just gender, with other aspects such as ethnicity, age, neurodiversity and sexual orientation all important in ensuring inclusive workplaces that provide equal opportunity and are free from discrimination. Given the limited corporate disclosure on measuring these other parts of diversity/inclusion, we have focused our analysis on gender, and will increasingly look to incorporate other diversity measures and promote this through our active engagement with companies.
Income Inequality
Income inequality has become a contentious social issue with a seemingly ever-expanding discrepancy between the wealth of people at the top and bottom ends of the spectrum in society. Research from the Ministry of Social Development showed that New Zealand households in the 80th percentile had disposable incomes nearly three times higher than households in the 20th percentile in 2014.6
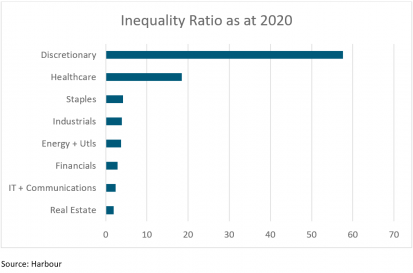
Our analysis measured the degree of remuneration inequality for employees in listed companies through calculating the ratio of the total number of employees to the number of employees that earn above $100k. The results revealed that this ratio ranged from 1.9 for the real estate sector on the lower end of remuneration inequality all the way to 57.6 on the high end for the consumer discretionary sector. The consumer discretionary sector was skewed to the upper end given the high proportion of workers in retail and hospitality on below average wages. The healthcare sector showed the largest improvement in reducing income inequality.

There are initiatives that companies can undertake to help address remuneration inequality within their businesses such as becoming an accredited living wage employer or offering a profit-sharing scheme across all employees. Mainfreight is an excellent case study in this regard as they have always had a strong employee focus, as shown through their policy of paying all their employees above the living wage and also rewarding them with a share of the firm-wide bonus pool in years of solid performance. They have subsequently made solid progress in reducing their inequality ratio over the past few years according to our analysis.
Conclusion
Overall, our research into measures of human capital management across the New Zealand listed market has shown an encouraging level of gender diversity across companies and generally improving health and safety performance. However, further improvement can be made in the measurement and disclosure of injury statistics, mental health initiatives and different types of diversity. Additional effort could also be made by companies in their remuneration practices to avoid excessive income inequality.
An underlying theme in these social considerations is the alignment with the SDGs, given three of the goals target good health and wellbeing (SDG 3), improving gender equality (SDG 5) and reducing inequalities (SDG 10).

At Harbour we continue to seek ways that we can invest to contribute to these goals and this research provides useful context to inform our view on companies demonstrating leading ESG practices.
The third and final edition of our social spotlight will cover supplier relations and modern slavery risk, an area of increasing focus with greater legislation and investor scrutiny in recent years. Indicators of modern slavery, health and safety, diversity and remuneration practices are all incorporated in our ESG assessment process and engagement with companies which will continue to evolve over time.
Video
References
- Ministry of Health (2020) New Zealand Health Survey https://minhealthnz.shinyapps.io/nz-health-survey-2019-20-annual-data-explorer/_w_c8bfdadf/#!/explore-indicators
- Dianne McAteer (2013) Gender Diversity Trends in the New Zealand Governance Environment 2003-2013_ (women.govt.nz)
- United Nations Sustainable Development Goals Goal 5 | Department of Economic and Social Affairs (un.org)
- 30% Club (30percentclub.org)
- 40:40 Vision (hesta.com.au)
- Ministry of Social Development – The Social Report 2016 Income inequality: The Social Report 2016 – Te pūrongo oranga tangata (msd.govt.nz)
IMPORTANT NOTICE AND DISCLAIMER
Harbour Asset Management Limited is the issuer and manager of the Harbour Investment Funds. Investors must receive and should read carefully the Product Disclosure Statement, available at www.harbourasset.co.nz. We are required to publish quarterly Fund updates showing returns and total fees during the previous year, also available at www.harbourasset.co.nz. Harbour Asset Management Limited also manages wholesale unit trusts. To invest as a Wholesale Investor, investors must fit the criteria as set out in the Financial Markets Conduct Act 2013. This publication is provided in good faith for general information purposes only. Information has been prepared from sources believed to be reliable and accurate at the time of publication, but this is not guaranteed. Information, analysis or views contained herein reflect a judgement at the date of publication and are subject to change without notice. This is not intended to constitute advice to any person. To the extent that any such information, analysis, opinions or views constitutes advice, it does not take into account any person’s particular financial situation or goals and, accordingly, does not constitute financial advice under the Financial Markets Conduct Act 2013. This does not constitute advice of a legal, accounting, tax or other nature to any persons. You should consult your tax adviser in order to understand the impact of investment decisions on your tax position. The price, value and income derived from investments may fluctuate and investors may get back less than originally invested. Where an investment is denominated in a foreign currency, changes in rates of exchange may have an adverse effect on the value, price or income of the investment. Actual performance will be affected by fund charges as well as the timing of an investor’s cash flows into or out of the Fund.. Past performance is not indicative of future results, and no representation or warranty, express or implied, is made regarding future performance. Neither Harbour Asset Management Limited nor any other person guarantees repayment of any capital or any returns on capital invested in the investments. To the maximum extent permitted by law, no liability or responsibility is accepted for any loss or damage, direct or consequential, arising from or in connection with this or its contents.
