- The NZ housing market has woken from its slumber in recent months with house prices up 1.3% since October and sales approaching long-term average levels. Several factors look set to limit the pace of recovery, including low population growth, a soft labour market, poor affordability, a large number of listings and low rental yields.
- We respecify and re-estimate our house price model to include post-Covid data and add housing stock as a supply-side variable. It explains 60% of the variation in house prices over the past 30 years and while regional outcomes are likely to vary significantly, suggests 7% house price growth this year. Aspects such as housing costs, including council rates did not prove to be significant in our model, but argue for a lower house price growth rate.
- There are little implications for monetary policy or markets as most forecasters, including the RBNZ, assume a modest recovery in house prices this year. Instead, we remain focussed on the combination of soft domestic demand and weaker trading partner growth likely requiring the OCR to reach 2.50%, versus market pricing of 2.80%, and have positioned fixed income portfolios accordingly.
The NZ housing market has woken from its slumber in recent months with house prices up 1.3% since October and sales approaching long-term average levels. Mortgage borrowing has started to pick up from low levels, led by owner occupiers. Housing credit growth is approaching 5% y/y, from a low of 3% at the end of 2023. Lower mortgage rates are the most likely explanation as these have dropped c.2% from their early 2024 highs. This should continue to be a positive influence as more borrowers re-fix on to lower rates with almost 70% of outstanding mortgages fixed for 1-year and less, as of March. The average outstanding mortgage rate has only just started to drop from a peak of 6.4% in October last year to 6.0% currently, but should approach the lowest rates in the market that are around 5% (see chart below).
Another positive for prices may be the lack of new supply with 34,000 building permits issued over the year to March 2025 vs. recent highs of more than 50,000 for the year ended March 2022 and an average of more than 40,000 over the past 6 years. For the past year, 16,000 of those permits issued were for houses, 2,100 for apartments, 1,600 for retirement villages and 14,300 for townhouses, flats or units. If our population grows between 1 and 2% y/y, that’s 53,000 to 106,000 additional people each year that need housing. Assuming the current 2.7 people per house, that translates to a need of 20,000 to 40,000 houses per year. 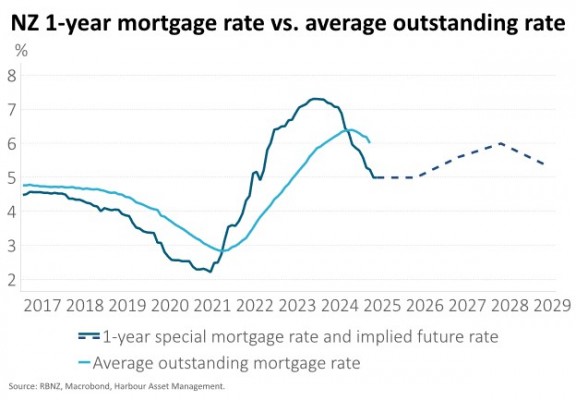
Several factors look set to limit the pace of recovery, however:
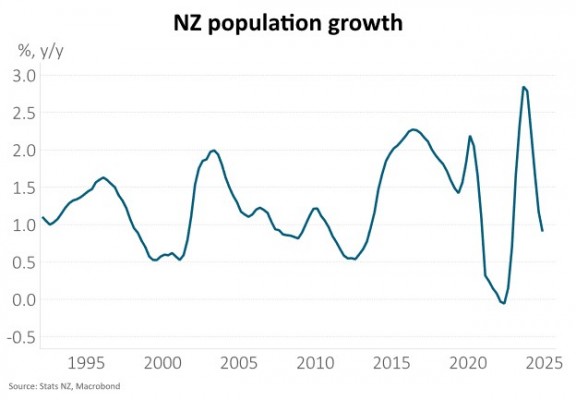
1) Low population growth and a soft labour market. A large drop in migration has seen population growth drop to just 0.9% y/y from almost 3% y/y at the end of 2023 and versus the long-term average of 1.3% y/y (see chart below). Job security remains weak with the unemployment rate above 5% and modest employment growth.
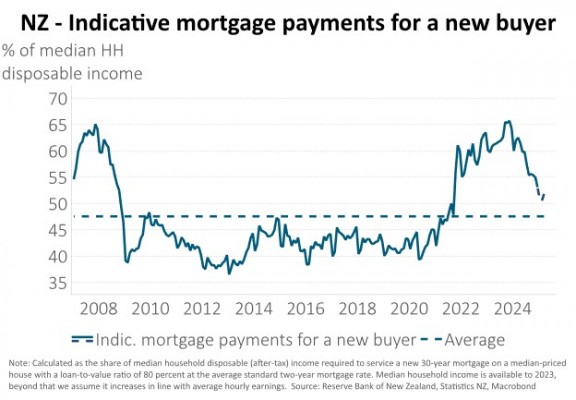
2) Affordability remains poor. The median house price to income ratio has dropped from a peak of 12 times at the end of 2021 to around 9 times currently. While this is a notable improvement, it remains well above pre-Covid levels of 7-8 times. Another affordability metric is to estimate the proportion of household disposable income needed to service an “average” mortgage. We estimate that this has also improved from 65% to a bit over 50% but is notably higher than the decade prior to Covid (see chart below).
3) Other housing costs have risen. Another aspect that affects affordability is the cost of house maintenance, insurance and council rates. Each of these have increased significantly over the last 5 years, with council rates likely to keep climbing well above the inflation rate. While changes in mortgage rates have a bigger effect in dollar terms for those with large mortgages, all house owners face these higher costs. Our house price model (outlined below) did not measure these costs as a statistically significant explanatory variable, but it seems likely that the aggregate cumulative impact of these price rises are becoming increasingly significant. The impact of this over time suggests lower house prices and lower mortgage rates, via a lower OCR.
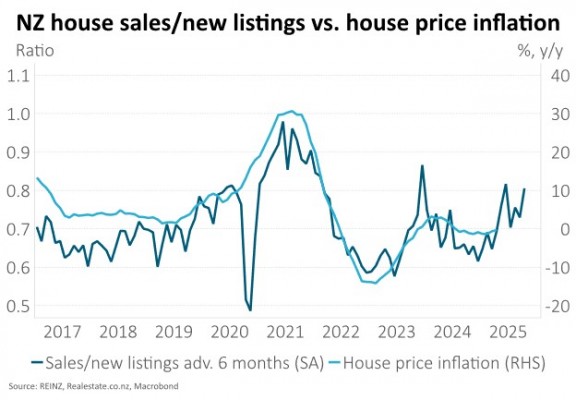
4) Large amounts of listings and extended days to sell suggest it’s still a buyer’s market. co.nz reported that more than 33,000 properties were for sale in April, well above the average of the past 10 years and post-Covid low of 14,000. The ratio of sales to listings indicates modest house price growth over the next 6 months (see chart below). Days to sell suggest buyers are in no hurry with these averaging 44 in April, above the average of less than 40.
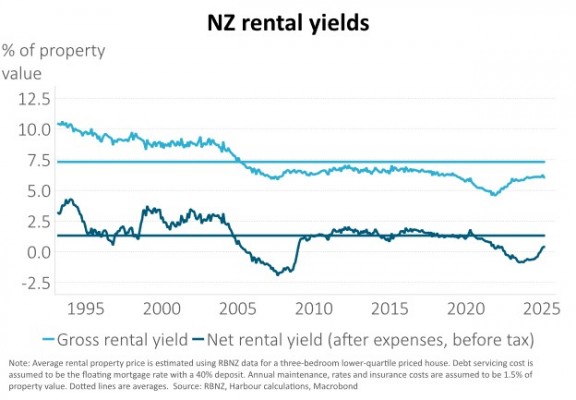
5) Investor maths remains challenging. The tax advantages of housing investment have returned in the form of interest deductability and a reduction in the bright-line period, where capital gains tax would be applied to investment properties, to two years from five years. Rental yields, however, remain low versus history and new rents are growing at just 1% per annum. These rental yields are particularly poor once you deduct debt servicing, rates, insurance and maintenance costs (see chart below). For example, council rates and dwelling insurance are up a whopping 46% and 58%, respectively, from pre-Covid levels. Looking ahead, council rates are likely to continue to be a significant impost to landlords, particularly in places like Wellington where the council has indicated council rates will rise by 7% per annum on average over the next 10 years.
Re-estimating our house price model and including a supply-side variable
We first specified a model for NZ house prices in March 2020 where the determinants were population growth, mortgage rates and the unemployment rate (see How vulnerable is our housing market?, 17 March 2020). The model was able to explain almost 70% of the variation in house prices from 1996 to 2019.
House price movements since Covid, however, have been harder for the model to explain. Re-estimating the model with an additional 5 years of data saw it only able to explain 45% of the variation in house prices over the past 30 years, though all of the explanatory variables remained statistically significant.
In response we have done three things:
1) Re-examined the dummy variables we had used for the Global Financial Crisis (GFC), the three rounds of RBNZ LVR restrictions (2013, 2015 and 2016) and the capital gains tax proposal in 2018. In our original model, we included all of these regardless of whether they tested as statistically significant or not. A more appropriate approach is to only include those that are statistically significant. Once we re-estimated the model, these were the GFC, 2016 RBNZ LVR changes and the capital gains tax proposal. In the process, we also added a dummy variable for Covid (Q2 2020 to Q1 2021) which tested as highly significant. This lifted the model’s explanatory power to just above 50%.
2) We looked at including additional explanatory variables such as affordability metrics, home ownership costs, sentiment and supply measures. Of these, only changes in housing stock had an intuitive (negative) sign and was statistically significant. On this basis, we included housing stock as a supply variable which meanignfully improved the explanatory power to almost 60%.
3) Finally, we made some adjustments to the existing explanatory variables but these had a negligible effect on explanatory power. Population growth was found to be more significant for house prices at a lag of 4 quarters, vs. 2 quarters previously, and we judged that 2-year mortgage rates better reflect borrower preferences than 5-year mortgage rates.
While regional outcomes are likely to vary significantly, our updated model (see table below) currently suggests house price growth of 7% this year, a fair bit higher than the RBNZ’s forecast of 3.7% but broadly in line with bank economist estimates (ANZ: 4.5%, ASB: 5%, BNZ: up to 5% and Westpac: 6.2%).
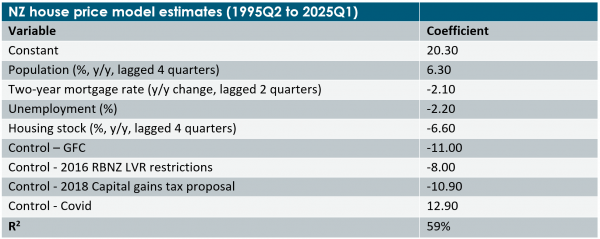
Note: House prices are the Real Estate Institute of NZ (REINZ) House Price Index (HPI). We control for the following: The distortion caused by the Global Financial Crisis (GFC) for the period Q1 2008 to Q4 2009. The distortion from Reserve Bank of New Zealand (RBNZ) Loan-to-Value Ratio (LVR) restrictions that were tightened at the end of 2016 (Q4 2016 to Q4 2017). We also control for the period where the NZ government was considering a capital gains tax (Q2 2018 to Q2 2019) - a period that also coincided with the introduction of a foreign buyer ban in October 2018. Finally, we control for the unusual period of Covid lockdowns from Q2 2020 and Q1 2021.
There are little implications for monetary policy or markets as most forecasters, including the RBNZ, assume a modest recovery in house prices this year. Instead, we remain focused on the combination of soft domestic demand and weaker trading partner growth likely requiring the OCR to reach 2.50%, versus market pricing of 2.80%, and have positioned fixed income portfolios accordingly.
IMPORTANT NOTICE AND DISCLAIMER
This publication is provided for general information purposes only. The information provided is not intended to be financial advice. The information provided is given in good faith and has been prepared from sources believed to be accurate and complete as at the date of issue, but such information may be subject to change. Past performance is not indicative of future results and no representation is made regarding future performance of the Funds. No person guarantees the performance of any funds managed by Harbour Asset Management Limited.
Harbour Asset Management Limited (Harbour) is the issuer of the Harbour Investment Funds. A copy of the Product Disclosure Statement is available at https://www.harbourasset.co.nz/our-funds/investor-documents/. Harbour is also the issuer of Hunter Investment Funds (Hunter). A copy of the relevant Product Disclosure Statement is available at https://hunterinvestments.co.nz/resources/. Please find our quarterly Fund updates, which contain returns and total fees during the previous year on those Harbour and Hunter websites. Harbour also manages wholesale unit trusts. To invest as a wholesale investor, investors must fit the criteria as set out in the Financial Markets Conduct Act 2013.